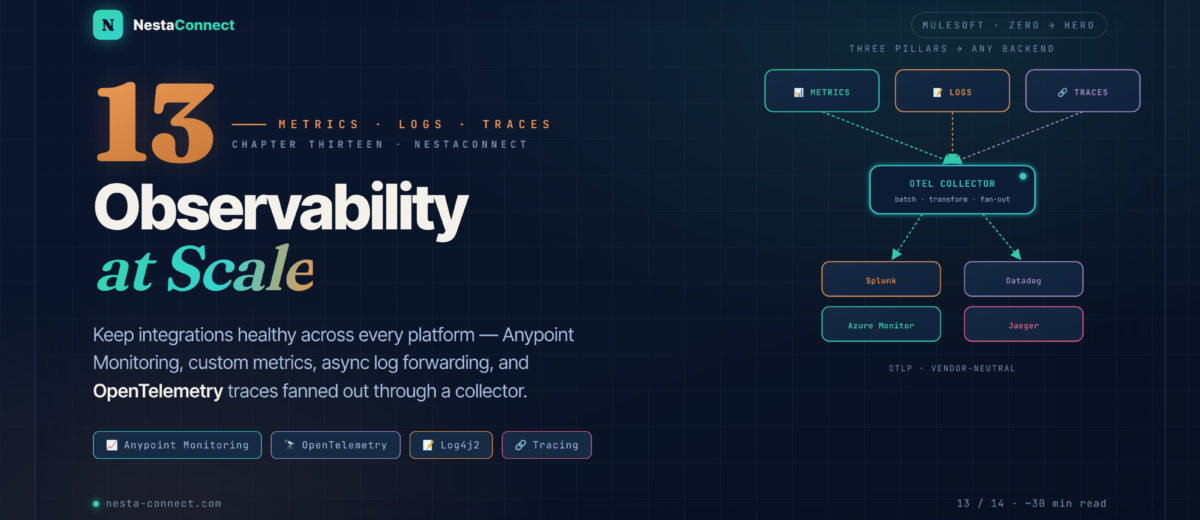
Building an integration is half the job; keeping it healthy is the other half. Metrics tell you something’s wrong, logs tell you what, and traces tell you where — across Anypoint Monitoring, Splunk, ELK, Azure, and any OpenTelemetry backend.
You’ve secured your integrations in Chapter 12; now you have to operate them. When an order pipeline starts failing at 2 a.m., you need three things fast: a signal that something broke, the log line that explains it, and a trace that shows exactly which hop in a chain of services went dark. That’s the three pillars of observability — metrics, logs, and traces — and MuleSoft gives you a built-in stack plus open paths to every major platform.
The companion repo carries the observability building blocks: a Custom Metrics flow using custom-metrics:send, async Log4j2 appenders for Splunk / ELK / Azure with MDC correlation, an OpenTelemetry Collector config that fans out to multiple backends, and the payment-gateway troubleshooting walkthrough.
By the end of this chapter you will:
- Use Anypoint Monitoring dashboards and alerts, and enable distributed tracing
- Send business metrics with the Custom Metrics connector — the correct
custom-metrics:sendoperation - Forward logs to Splunk, ELK, and Azure with asynchronous Log4j2 appenders
- Correlate everything with MDC —
correlationId,traceId,spanId - Export OpenTelemetry traces (and logs) via the Direct Telemetry Stream and an OTel Collector
- Diagnose a real incident by triangulating across all three pillars
01 · Three Pillars — Metrics, Logs & Traces
Observability isn’t one tool — it’s three complementary signals. Each answers a different question, and you need all three to move from “something’s wrong” to “here’s the fix” without guessing.
02 · Anypoint Monitoring — Built-in Dashboards & Alerts
For apps on CloudHub 2.0 and Runtime Fabric, Anypoint Monitoring collects metrics, logs, and traces automatically — reachable via Runtime Manager → your app → Monitoring. Out of the box you get an Application panel (throughput, error rates, response times, JVM heap/GC/threads) and an API panel (requests by method, response codes, latency percentiles).
2.1 · Alerts that page you
Alerts fire when a metric crosses a threshold for a sustained window. Create them under Alerts → Create Alert in Runtime Manager. A well-tuned alert names a resource, a metric, a condition, a duration (to avoid flapping), and a notification channel.
| Field | Example |
|---|---|
| Resource | customer-api (Production) |
| Metric | app_inbound_error_rate |
| Condition | > 5% |
| Duration | 5 minutes (sustained, not a blip) |
| Notify | Email · Slack · PagerDuty |
At deploy time, open your app’s Settings in Runtime Manager and turn on Enable tracing. Mule then generates OpenTelemetry spans, propagates W3C Trace Context headers (traceparent, tracestate), and surfaces traces in Anypoint Monitoring — and, as you’ll see in §5, can stream them to any external backend.
03 · Custom Metrics — Tracking Business KPIs
Platform metrics tell you the runtime is healthy; custom metrics tell you the business is healthy — orders per minute, payment success rate, processing time by region. These come from the Custom Metrics connector, which sends data to Anypoint Monitoring. It requires the Anypoint Monitoring Agent and a supported runtime.
A persistent piece of misinformation online uses an invented metrics:increment operation. The real connector exposes a single Send Custom Metric operation — <custom-metrics:send> — that takes a map of dimensions (low-cardinality labels) and a map of facts (numeric values). Use the correct dependency and operation, or your metrics silently never arrive.
<dependency>
  <groupId>com.mule.modules</groupId>
  <artifactId>mule-custom-metrics-extension</artifactId>
  <version>2.3.2</version>
  <classifier>mule-plugin</classifier>
</dependency><custom-metrics:send config-ref="Custom_Metrics"
metricName="order.processing">
<!-- dimensions: LOW cardinality labels you slice by -->
<custom-metrics:dimensions>#[{
status: "success",
region: payload.region,
customerTier: payload.tier
}]</custom-metrics:dimensions>
<!-- facts: NUMERIC values only -->
<custom-metrics:facts>#[{
count: 1,
orderValue: payload.totalAmount,
processingTimeMs: now() - vars.startTime
}]</custom-metrics:facts>
</custom-metrics:send>Low-cardinality dimensions only. Never use customerId, sessionId, or a timestamp as a dimension — each unique value is a new time series, and you’ll blow up storage and cost. Use region, tier, productCategory instead. Facts must be numeric. And avoid reserved keywords (e.g. SELECT, WHERE, GROUP) as dimension names.
04 · Logs Everywhere — Splunk, ELK & Azure via Log4j2
Mule logs through Log4j2, so forwarding to an external platform is a matter of adding the right appender to src/main/resources/log4j2.xml. Two non-negotiables: appenders must be asynchronous (a slow log backend must never block your message thread), and secrets must come from placeholders, never hardcoded.
| Platform | Library (pom.xml) | Transport |
|---|---|---|
| Splunk | splunk-library-javalogging | HTTP Event Collector (HEC) |
| ELK | logstash-log4j2-encoder + Filebeat | JSON → Logstash / Filebeat module |
| Azure | applicationinsights-logging-log4j2 | Application Insights |
<Configuration>
  <Appenders>
    <SplunkHttp name="splunk"
        url="https://http-inputs.splunk.com:443"
        token="${sys:splunk.token}"          <!-- never hardcode -->
        index="mule" source="mule-app">
      <PatternLayout pattern="%d %p [%X{correlationId}] %c - %m%n"/>
    </SplunkHttp>
    <!-- wrap ANY appender to make it non-blocking -->
    <Async name="asyncSplunk">
      <AppenderRef ref="splunk"/>
    </Async>
  </Appenders>
  <Loggers>
    <AsyncRoot level="INFO">
      <AppenderRef ref="asyncSplunk"/>
    </AsyncRoot>
  </Loggers>
</Configuration>Mule automatically populates the Mapped Diagnostic Context with correlationId, and — when tracing is on — traceId and spanId. Reference them in your pattern with %X{correlationId}. Now every log line for one transaction shares an ID you can pivot on, and that same traceId links the log straight to its distributed trace. For ELK specifically, the Mule Filebeat module ships pre-built Kibana dashboards once you point it at the Mule event logs.
05 · OpenTelemetry — Vendor-Neutral Distributed Tracing
OpenTelemetry (OTel) is the open standard for telemetry, and Mule runtime speaks it natively. With the Direct Telemetry Stream (Mule 4.11.0+), the runtime exports traces and logs in OTLP format to any compatible backend — Jaeger, Datadog, Dynatrace, Splunk, Azure. You enable it in the deployment settings alongside “Enable tracing.”
When you run the community OpenTelemetry module (or the SDK in autoconfigure mode), you point the exporter at your collector through standard OTel properties — set as system properties or environment variables:
# export traces and logs over OTLP to the collector
otel.traces.exporter=otlp
otel.logs.exporter=otlp
otel.exporter.otlp.endpoint=http://otel-collector:4318
otel.exporter.otlp.protocol=http/protobuf
otel.service.name=customer-api
otel.resource.attributes=environment=production,region=us-east-1

# sample to control volume in production
otel.traces.sampler=parentbased_traceidratio
otel.traces.sampler.arg=0.1 # 10% of tracesFirst, native OpenTelemetry support — the Direct Telemetry Stream — covers traces and logs from Mule 4.11.0+; metrics over OTel are not yet there (JVM metrics begin arriving with the 4.12 Edge runtime). Keep using Anypoint Monitoring / custom metrics for metrics today. Second, when you use the Direct Telemetry Stream, Anypoint Monitoring’s own OpenTelemetry exporter features aren’t available — they’re alternative paths, not stacked. Context propagation across HTTP also needs the HTTP Connector 1.8+.
5.1 · Correlating with Azure Application Insights
Azure keys distributed traces off the W3C traceparent header, mapping it to operation_Id. With tracing enabled, Mule’s HTTP Listener and Requester propagate traceparent automatically — so the fix when correlation breaks is almost always a component (or proxy) overwriting or stripping that header. Verify nothing in the chain rewrites traceparent, and the same operation_Id will line up across every span.
06 · Case Study — Diagnosing Payment-Gateway Failures
An e-commerce platform hits intermittent order failures. The on-call engineer uses all three pillars in sequence — and finds the root cause in minutes, not hours.
HTTP:CONNECTIVITY; Splunk shows “connection refused” to the eu-west-1 gateway; the Jaeger trace shows the payment span timing out at 10s with no downstream DB span. Root cause: a load-balancer firewall change dropped the app’s new auto-scaled IP range.index=main sourcetype=mule-app errorType="HTTP:CONNECTIVITY"
| timechart count by regionThe alert caught it before customers complained. The region dimension on the custom metric localized the blast radius instantly. The correlated logs and trace — sharing one ID — pinpointed the exact failing hop, so nobody wasted time suspecting the database. The fix (restore the firewall rule) took minutes; the team then added a circuit breaker around the gateway and an alert on its reachability.
07 · Best Practices — Observability Rules That Hold Up
| Practice | Why it matters | How |
|---|---|---|
| Custom metrics for KPIs | Runtime health ≠ business health | custom-metrics:send with numeric facts |
| Low-cardinality dimensions | IDs explode series count and cost | Use region/tier, never customerId |
| Always async logging | A slow sink must not block the flow | <Async> / <AsyncRoot> appenders |
| Sample traces in prod | 100% tracing is expensive at volume | Parent-based ratio sampler (e.g. 10%) |
| Propagate trace context | Broken traceparent = broken correlation | Don’t strip/override the header anywhere |
| Use an OTel Collector | Decouples Mule from the backend vendor | Fan out from one collector; swap freely |
08 · Recap — What You Now Know
Metrics, logs, traces
Each answers a different question; together they take you from “something broke” to “here’s the fix.”
- Metrics → is it healthy?
- Logs → what happened?
- Traces → where did it break?
- Correlate via a shared ID
Built-in, then alert
Automatic dashboards for app and API panels; threshold alerts that page you; one toggle to enable tracing.
- App + API panels OOTB
- Alert: metric · condition · duration
- Enable tracing in Settings
- W3C trace context emitted
Business KPIs, the right way
custom-metrics:send with low-cardinality dimensions and numeric facts — not the mythical metrics:increment.
mule-custom-metrics-extension- dimensions + numeric facts
- no IDs as dimensions
- needs the Monitoring Agent
Forward, async, masked
Log4j2 async appenders to Splunk/ELK/Azure; MDC ties every line to a transaction via correlationId.
- Always
<Async>appenders - Secrets via
${sys:...} %X{correlationId}in pattern- Filebeat module for ELK
Vendor-neutral tracing
Direct Telemetry Stream (4.11+) exports traces & logs via OTLP; a collector fans out to any backend.
- Traces + logs native at 4.11+
- OTel metrics still emerging
- Collector decouples the backend
- Don’t strip
traceparent
Three pillars, one incident
Alert → metric → log → trace, carried by a shared ID, pinpoints the failing hop in minutes.
- Dimensions localize the blast radius
- Logs explain the error
- Traces find the exact hop
- Fix, then add a circuit breaker
The companion repo carries the observability stack: the custom-metrics:send flow, async Log4j2 appenders for Splunk / ELK / Azure with MDC correlation, an OpenTelemetry Collector config that fans out to multiple backends, and the payment-gateway triage walkthrough. Wire it into a sandbox and trip a failure to watch the pillars light up.